Benutzer-Werkzeuge
Inhaltsverzeichnis
VVVV - Advanced Techniques
VVVV is a visual and data stream oriented, real-time programming language that was developed around the year 2000 by the VVVV-group (Joreg, Max Wolf, Sebastian Gregor, Sebastian Oschatz). Their aim is to make the development of prototypes, artworks, … easily possible for people without programming skills.
Idea behind VVVV
The basic idea of VVVV is that you have small units (called „nodes“) that solve simple problems. The user can connect these nodes with lines (called „links“) to solve more complex problems.
Additionally VVVV runs in real-time. So every change in the program gets visible immediately.
User Interface
At the first start the user interface of vvvv can be very confusing. All the usual menus and toolbars that you find in common IDEs are missing. Everything you see is just a grey empty window (called „patch“). But that is what makes the user interface of VVVV: A very puristic and simple design.

To use VVVV efficiently a keyboard and a mouse with three buttons is indispensable. Even to open the menu you need the third button of the mouse.
In the table below you find the most common shortcuts according to the user interface which facilitate the work with VVVV extensively.
| Shortcut | Function |
|---|---|
| Middle mouse button | Open menu |
| CTRL + S | Save patch |
| CTRL + W | Close window |
| ALT + F4 | Close VVVV |
Basics
Nodes
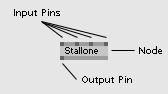
 Nodes are the smallest units with basic functions. They get information over their input pins, process it and dump the result out over their output pin. Regarding to the most common textual programming languages they could be compared with functions/methods. If you continue this comparison the input pins would be the parameters and the output pin the return value. The only difference would be that nodes in VVVV can have multiple output pins. VVVV provides a lot of different nodes and therefore a lot of different functions.
 Note: Nearly every patch in VVVV has a help patch that demonstrates its function. To open it just select the node with a left click on it it and press „F1“ afterwards.
Node browser
The node browser is a list of all available nodes in VVVV. To open the node browser just perform a double left click into the patch on a empty place. With a right click into the search field the user has the ability to switch between the three following different modes.
Alphabetical list
In this mode the nodes are ordered alphabetically by name and listed together with their category in brackets.

Category list
In this mode a list of all categories is presented to the user. If the user clicks on a category all the nodes of it are listed below. This mode is very useful to browse easily through all nodes of one category.

Filter
In this mode the user can select/deselect which categories are searchable.

Create a node
The creation of a node is very simple. Just follow these steps:
- Perform a double left click; the so called „node browser“ will be opened
- Start typing the name of the node you want to create; there will be offered that nodes to you which fit to your input
- Click on the node you want to create or press enter if the node is already selected
Special node: IOBox
IOBoxes are special nodes. They represent the various primitive datatypes like Value, String, Enumeration, and so on.
How to create an IOBox
- Perform a double right click
- A list with all IOBoxes is opened
- Left click on the IOBox you want to create
List of all IOBoxes

Herr Inspektor
 Herr Inspektor is a very helpful tool to change all the settings of a node at one place. It is opened with the shortcut CTRL + I. Herr Inspektor always shows the information and settings according to the actually selected node with the option „Attach to Selection“
as an exception. If you selecte multiple nodes, Herr Inspektor only shows the options / informations that all selected nodes have in common.
Herr Inspektor is a very helpful tool to change all the settings of a node at one place. It is opened with the shortcut CTRL + I. Herr Inspektor always shows the information and settings according to the actually selected node with the option „Attach to Selection“
as an exception. If you selecte multiple nodes, Herr Inspektor only shows the options / informations that all selected nodes have in common.
Herr Inspektor is divided into three category groups from top to bottom:
- Configuration of the visual and functional properties
- Configuration of the input pins
- Configuration of the output pins
The box in front of each input respectively ouptup pin indicates the following:
| Box | Impact |
|---|---|
| White Box | Pin is deactivated |
| Light gray box | Pin is activated but hidden |
| Dark gray box | Pin is activated and visible |
The color of the box can be changed by a simple left click on it.
Shorcuts
| Shortcut | Function |
|---|---|
| CTRL + I | Open Herr Inspektor |
| SHIFT + CTRL + I | Open multiple instances of Herr Inspektor |
Links
Links are an essential component of VVVV. With them values can be passed from one node to another.
How to create links
- Left click on the output pin of the first node
- Another left click on the input pin of the second node
How to create multiple links at once
- Right click on the output pin of the first node
- Left click on a suitable input pin of the first node
- Left click on a suitable input pin of the second node
- Right click on an empty place to stop making links
Dataflow
„VVVV is a data stream oriented programming language. The evaluation always starts at the top with the first node and stops at the bottom of the patch with the last node.“ 1)

You can download the patch from the image here: Dataflow Example
Spreads and Slices
 Spreads can be compared with arrays in a text-based programming language. They consist of multiple elements like numbers or string, which in this domain are called slices. Because spreads are supported by nearly all nodes in vvvv, they are very important and powerful.
Spread Generators
Spread generators automatically generates a spread, which values obey a specific rule. In the case of the linear spread this rule would be, that there is the same distance between two successive slices. The most important spread generators are:
- LinearSpread - This spread generator generates one spread, which slices always have the same distance to their neighbors.
- RandomSpread - This spread generator generates one spread, which contains random values, within the defined width.
- CircularSpread - This spread generator generates two spreads, one for the X coordinate and one for the Y coordinate of points, which are on a circle.
- TypoSpread - This spread generator generates two spreads, one for the X coordinate and one for the Y coordinate of points, which together model letters or text.
You can download the patch of the image here: Spreads Example
Saving
The user can either simply save a patch with choosing the option „Save“ in the menu or save it with a new name or at an other place with the option „Save as“. The first save of a patch is always a „Save as“-action.
With every save-action a backup file of the last revision is saved to the same folder as .xml-file. To open this file in VVVV the file extension has to be changed to „.4vp“.
The „Save as“ action always shows (after choosing the file path) the following window with various options:

ItemReload Now (Recommended)
Reloads the patch and checks all links to subpatches of external files. You should use this option, if you save your patch to an other folder to get sure, that all these links are refreshed.
ItemSave It (I know what I am doing)
Use this option, if you save the patch to the same place or if you do not have any links to subpatches or external links in it.
ItemSave All
Saves the patch and all subpatches in it.
| Shortcut | Function |
|---|---|
| CTRL + S | Save |
| SHIFT + CTRL + S | Save As… |
Renderer and Geometry
Renderer
 The Renderer is the output window of VVVV. There are multiple types of rederers available. The most common one is the Renderer (EX9). In contrast to other programming languages the renderer has a different coordinate system. The center (0,0) is in the middle of the window and not in the top left corner. Based on the center a common XY-coordinate system is used; so for example (1,1) is found the top right corner of the window.
| Shortcut | Function |
|---|---|
| ALT + 1 | Open renderer in extra window |
| ALT + 2 | Integrate renderer into patch |
| ALT + 3 | Integrate renderer into patch and hide it |
| ALT + ENTER | Fullscreen renderer |
You can download the patch from the image here: Renderer Example
Geometry 2D
VVVV provides different simple geometries that can be displayed in the Renderer. The most important ones are the Quad (DX9), the Grid (DX9) and the Segment (DX9). Whereas the Quad always consists of a fixed number of polygons the Grid has not a fixed number of them. The same holds for the Segment which approximates a circle if the number of polygons gets big.

You can download the patch from the image here: Geometry (2D) Example
Transformations
The node Transform (Transform 2d) enables various transformations on geometries. It is possible to translate them, scale them, rotate them or even change their center. The change of the center is very usefull if you want to animate something e. g. rotate a geometry with a distance from one around the center of the renderer.
Another important node is „AspectRatio (Transform)“. Connected as shown in the example below it prevents the content of the renderer from deformation when changing its size.

You can download the patch from the image here: Transformation Example
Layers
Layering in VVVV is usually done with the node „Group (EX9)“. The input pins of this node define the ordering of multiple geometries in z-direction. The geometry linked to the first pin of the group node is painted first in the renderer, the geometry linked to the second one as a second and therefore painted over the first one and so on.

You can download the patch from the image from here: Layer Example
Animations
The important node for doing animations in VVVV is the LFO (Animation) which counts permanently from zero to one in a definable periode. To get an animation this node is often linked with the Transform node. Due to the fact that the LFO starts abrupt counting from zero after reaching the one you get a very ugly jump in the animation. To avoid this the „WaveShaper (Value)“ can be used as shown in the example below.

You can download the patch from the image here: Animation Example
Filters
VVVV provides various filters to add an effect to animations e.g the „Oscilator (Animation) or the „Damper (Animation)“. The example patch from the VVVV library shown in the image below provides a nice overview over the filters.

You can download the patch from the image here: Filter Example
Colors
In VVVV various ways exist to represent color. As show in the example below you can use e.g. the HSV or the RGB color model with the node „HSV (Color Join)“ respectively „RGB (Color Join)“

You can download the patch from the image here: Color Example
Textures
Multiple options exist to map a texture on a geometry in VVVV: E.g. an image from a file („FileTexture (EX9.Texture)„), a website („HTMLTexture (EX9.Texture URL)„) or even the content of another renderer („SVGTexture (EX9.Texture)“) and so on.

You can download the patch from the image here: Texture Example
Note: „HTMLTexture (EX9.Texture URL)“ is only available in the 32-bit version of VVVV-addon-pack and not in the 64-bit version till now!
Typography
To change the presentation of text the node „Text (EX9)“ is used. It provides various settings like font, font size, alignment etc.

You can download the patch from the image here: Typography Example
Examples
Fancy Text

1. Rendering a point
- You first have to create a Renderer (EX9) as an output window.
- Next you create a Pillow (DX9) and connect it to the renderer.
- To resize and change the position of the point you also need a Transform (2D), which you connect to the Transform pin of the Pillow.
- Changing the scale X and Y of the transform to 0.01 will finally result in a smooth small point.

2. Multiply the points
- To generate the spread you have to create a TypoSpread (Spreads) and change its Spread Count to 400.
- You now can multiply the points by connecting the X and Y output pins of the TypoSpread to the corresponding translate pins of the Transform node.

3. Keyboard Input
- To use the keyboard as the input text for the TypoSpread you first have to create a Keyboard (System Global) (you can also use a Keyboard (System Windom)).
- If you connect the key pin of the keyboard directly to the text input pin of the TypoSpread you will only see text while the key is pressed. If you release the key there will be no output in the renderer. To solve this you can use a S+H (String) node, which only passes the values of the left input pin to the output pin, while the right input pin is greater than 0 (For more information you can open the help patch of the S+H node).
- Finally you can connect the keyboard to the S+H node and the output of the S+H node to the TypoSpread.
- If you press keys now, the pressed keys will be displayed in the renderer, until another key is pressed.

4. Color
- To add some color to the points you can create a HSV (Join) node and connect it to the color pin of the pillow.
- In order to change the color over time you can add a LFO (Animation) node and connect it to the hue pin of the HSV Join.
- If you also connect the X output of the TypoSpread to the phase input pin of the LFO the color will change in a different way than before, which looks more appealing.

5. Animation
- To animate the transition when a key changes you use a filter: the Oscillator (Animation).
- After you created the node you have to change the filter time input pin to 5 seconds, in order to make the animation last a bit longer.
- Now you can place it in between the TypoSpread and the Transform node.
- If you press a key now, there will be a smooth transition, when the input text changes.

6. Noise
- Now you want to add some noise to the position of the points. To do this you first have to create a Random (Value) node which creates one random value between 0 and 1.
- To get 300 values you can use a Select (Value) node. To get 300 slices you have to change the right input pin to 300 and the left input pin to 1.
- Now you can connect the select node to the random value node, which now produces 400 random values.
- Because the noise has to be uniform, you also have to create a Map (Value) node, in which you change the destination maximum to 0.5 and the destination minimum to -0.5.
- Connecting the random value node to the map node finally will result in 400 random values, ranging from -0.5 to +0.5.
- You now can add the values to the position of the points by placing a + (Value) node in between the TypoSpread and the oscillators.
- You should also create a * (Value) node and place it between the + node and the random number.

7. Microphone Input
- To get the loudness from the microphone input you can use the BeatDetector (Value) node.
- You first have to set some settings up in the BeatDetector. To do this you open the help patch of the BeatDetector and copy the whole patch in your patch.
- If you now connect the EnergyOut pin of the BeatDetector to the * node you are finished with this example.
- The amount of noise is now dependent on the volume of the microphone input and creates a nice looking effect on the displayed letters.
You can download the finished patch here: Fancy Text
Fancy Boxes

1. Rendering one Box
- At first you need a Renderer (EX9). If you work in a 3D scene you also have to do some changes in the renderer. To do this you create a Herr Inspektor and select the renderer. In the Inspektor you now search for the setting Windowed Backbuffer format and change it from NONE to D24X8.
- Next we create a AspectRatio (Transform) and connect it to the renderer. Note that the aspect ratio pin of the renderer is hidden by default, but you can still create link to it.
- To change the angle of the camera you now create a Camera (Transform Softimage) and connect the view and projection pins to the according ones of the renderer.
- Now you need a shader node, in our example the PhongPoint (EX9.Effect), which we connect to the layer pin of the renderer.
- The last thing we need for our basic rendering scene is the box itself. To render it we create a Box (EX9.Geometry) node which we connect to the PhongPoint node.

2. A Grid of Boxes
- Now you need to multiply the box to form a grid. You need a spreadgenerator to do this. To form a grid we use the LinearSpread (Spreads), we change the SpreadCount to 13 and the width to 2 to form a larger grid.
- The LinearSpread would only generate a 1D row of boxes. To get a 2D grid we add a Cross (2D) which we connect to the LinearSpread.
- To finally multiply the boxes you need a Transform (3D), from which you use the Translate X and Z input pins.
- If you now connect the Transform node to the PhongPoint node you will just see one big block. This is because the boxes are too big. To fix this we change the width and the depth of the boxes to 0.13.
- In addition to that we have to change the camera angle, because the boxes are very small. Therefore we change the pitch of the camera to 0.25 and the initial distance to 2.5.

3. Calculating the Distances
- In order to calculate the distance between the mouse and every box you use a Distance (2D) node.
- Because this node accepts vectors as an input you also have to create two Vector (2D Join) nodes, which you connect to the distance node.
- The first vector you need is the position of the mouse. Luckily the Renderer has two output pins, which output the actual position of the mouse. You have to connect those with the first Vector node.
- To get the position of every box we connect the X and Y outputs of the Cross node with the second vector.
- The Distance node now returns all 169 distances between every box and the mouse position.

4. Setting the Height
- To set the height of the boxes you first have to change their variance, because the exact distances only range from 0 to about 2.
- To do this you can use a logarithm, in our case the Log (Value) node, in which we change the right input pin to 1.8.
- Now you have the problem, that if the distance is 0 the output of the Log node is very high. To avoid this we place a Max (Value) node in between the distance and the Log node, which sets all values, which are smaller than 0.1 to 0.1.
- Finally you need a Map (Value) node, in which we change the range of the Log output from -8–1.7 to 5–0.5. If you change those values you can manipulate the maximum and minimum height of the boxes.
- After you connect the Map output pin to the height input pin of the Box the boxes now change their height according to the mouse position.

5. Adding Some Color
- To make the boxes look a bit better you can add some color. First you need to create a HSV (Join) node and connect it to the Diffuse Color input pin of the PhongPoint shader. After changing the Saturation of the HSV node to 1 all boxes are green.
- In order to change the color of the boxes according to their height you can use the same output of the Log node as in step 4. But in this case we change the mapping range to 1.0–0.0 in the Map (Value) node.
- You finally have to connect the output pin of the second Map node to the Hue pin of the HSV node and you are done!
- To make the colors look brighter you can change the Light Attentuation 1 pin of the PhongPoint shader to 0.2.
You can download the finished patch here: Fancy Boxes
Materials
Further information
Cheatsheet
Sources
This article is mainly based on chapter two of the below listed book „Prototyping Interfaces“. Additional information were gathered from the other listed sources.
- Jan Barth / Roman Stefan Grasy / Jochen Leinberger / Mark Lukas / Markus Lorenz Schilling: Prototyping Interfaces. Interaktives Skizzieren mit VVVV, Mainz 2013
Images
Except the following two images self generated screenshots were used:
- The image in the node section was taken from http://vvvv.org/sites/default/files/imagecache/large/images/node.png
- was taken from http://prax-08.deviantart.com/art/Boolean-1-1-166457851
Seiten-Werkzeuge
